The Analytics of Advantage: Exploring 'Total Points Gained' in the NBA
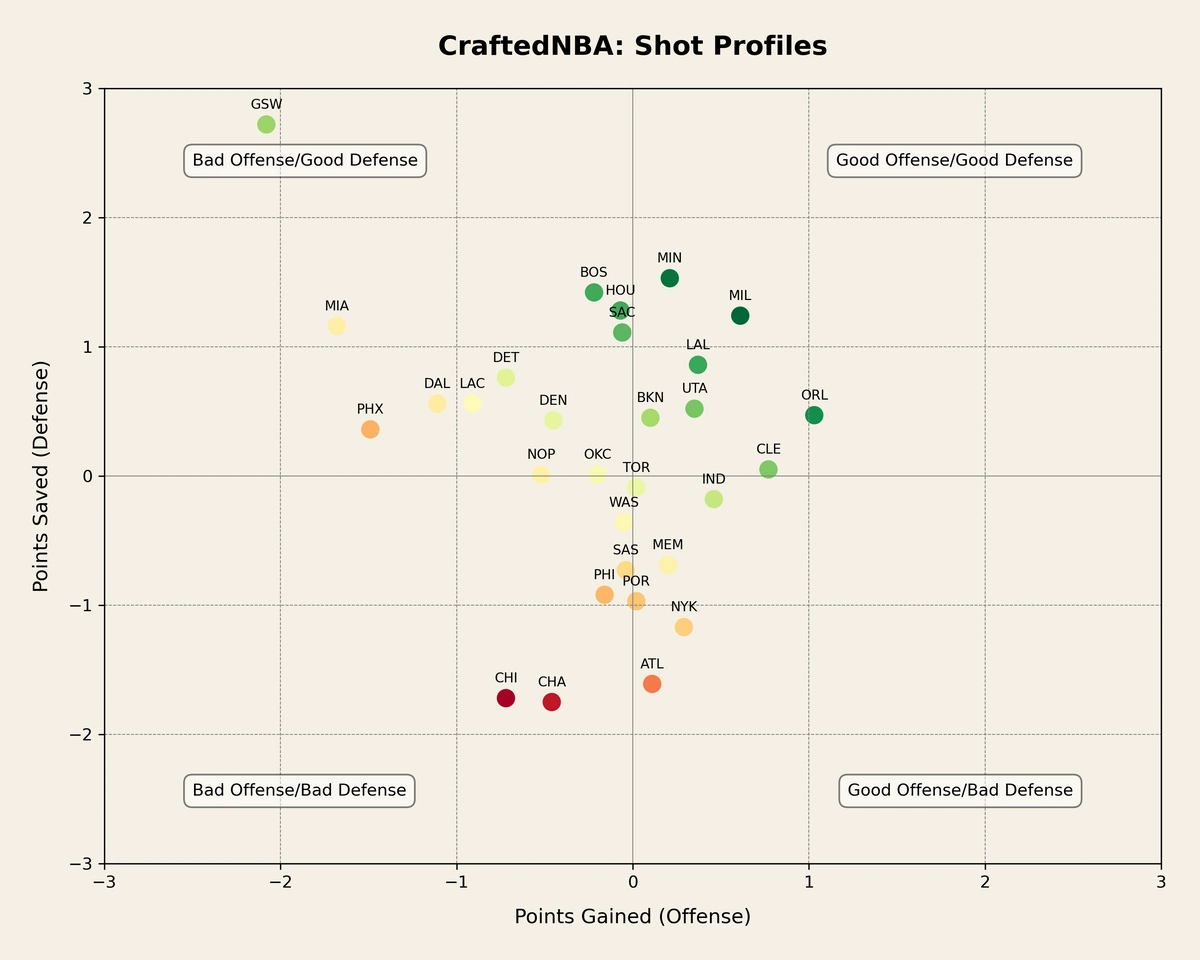
March 5, 2024In the NBA, some aspects of the game are beyond your control. A hot shooting night from an opponent, for instance, can be nearly impossible to overcome. However, one area teams can exert influence over is the shot selection—both their own and their opponents. It's interesting to note that statistics like three-point percentage requires around 250 attempts to stabilize. In contrast, the types of shots a team or its opponent takes can stabilize in as few as 12 minutes of gameplay. This realization led us to quantify the impact of shot profiles on a team's performance, with all values adjusted to per 100 possessions. For example, if the Chicago Bulls are effectively losing .75 points on offense and conceding an additional 1.75 points to opponents, they begin each game with a 2.5 point deficit based solely on their and their opponents shot profile. This is essentially the same as replacing 48 minutes from a solid rotation player with 48 minutes from one of the worst players in the league.
Total Points Gained is a nuanced metric assessing a team's shot selection and execution relative to league averages. This evaluation particularly focuses on shot locations identified as efficient by analyzing league-wide shooting data, including shots near the rim, mid-range, and beyond the three-point line.
Here’s an overview:
-
Efficient Zones: Shots from close to the rim and three-pointers, particularly corner threes, are deemed more efficient. The NBA's shot location data helps us understand where teams are taking their shots and how successful they are.
-
Calculating Points Gained: This involves analyzing the number of shots taken by a team in each zone and the points scored from these attempts. The results are then compared to what an average team would score from the same shot distribution and the league average shot distribution. Exceeding the average indicates efficiency in shooting or shot selection ("points gained"), whereas falling below suggests missed opportunities ("points lost").
-
Total Points Gained: By aggregating points gained or lost across all zones, this statistic offers a single-figure assessment of a team's offensive efficiency. A positive figure signals superior efficiency, reflecting prudent shot selection and execution. A negative value, conversely, indicates inefficiency and potential areas for strategic improvement.
"Total Points Gained" goes beyond traditional metrics like field goal percentage or points per game, highlighting the strategic importance of shot selection in scoring efficiency. This deeper insight into a team's offensive strategy complements "Total Points Saved," the defensive mirror metric. "Total Points Saved" evaluates defensive efficiency by analyzing opponents' shooting locations and effectiveness within those zones. Efficiency modifiers are crucial, as the defensive impact varies significantly based on the defender's ability. For instance, ten mid-range jumpers taken by sharpshooters like Devin Booker and Kevin Durant carry a different implication than the same attempts by Ben Simmons and Spencer Dinwiddie. Similarly, allowing shots at the rim with a defender like Jonathan Isaac nearby poses a different threat level than if Kelly Olynyk is the primary defensive presence.
As for where you can find these stats, they will update daily on the Team Stats page.
Sign up for our newsletter
Be the first to know about new features, upcoming releases and exclusive insights.
We care about the protection of your data.
We will never sell your information.
